768
patients in dataset
8
physiological features
3
classifiers trained
75.3%
SVM best accuracy
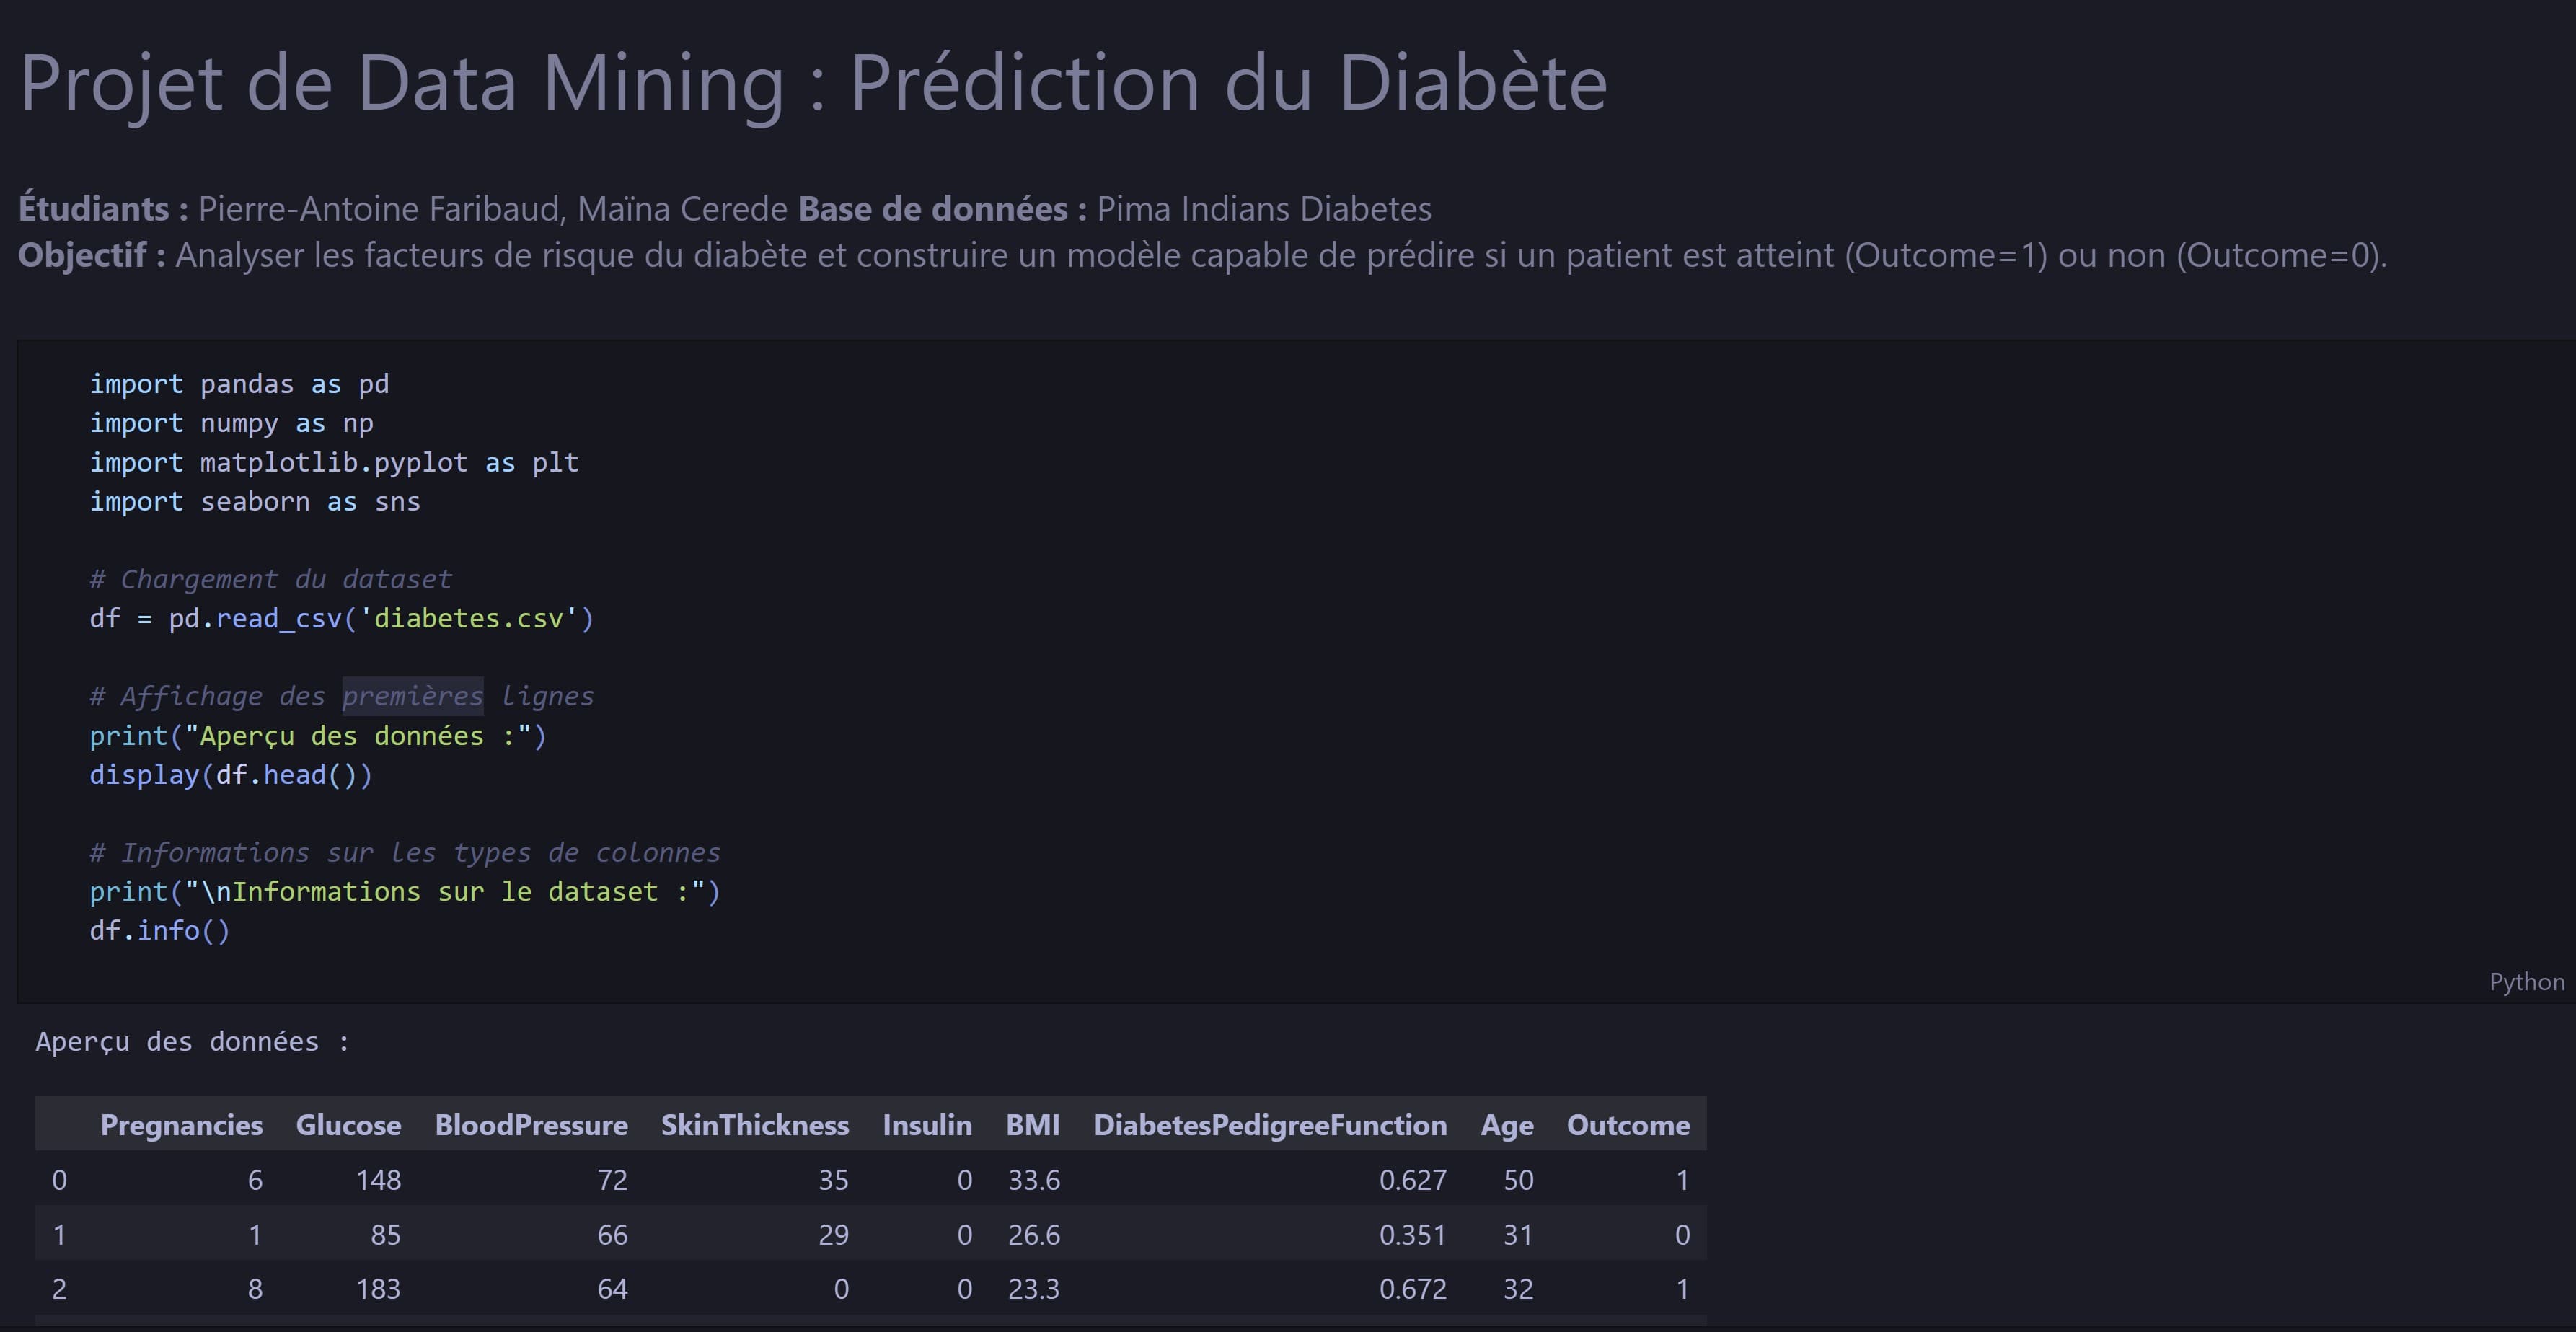
The Pima Indians Diabetes Database contains 768 patient records with 8 physiological measurements — Glucose, BMI, Insulin, Age, Blood Pressure, Skin Thickness, Diabetes Pedigree Function, and number of pregnancies — and a binary outcome: diabetic or not.
The goal was not just to reach the highest accuracy. It was to understand why the models behave the way they do, and to validate those patterns unsupervised — without looking at the labels.
The data has a hidden problem
Before any model was trained, the dataset needed cleaning. Zero values appear for physiological variables that are biologically impossible — Glucose = 0, BMI = 0. These are missing values, not real measurements. They were imputed with the median for each outcome class, preserving the class-specific distributions.
Three classifiers, three perspectives
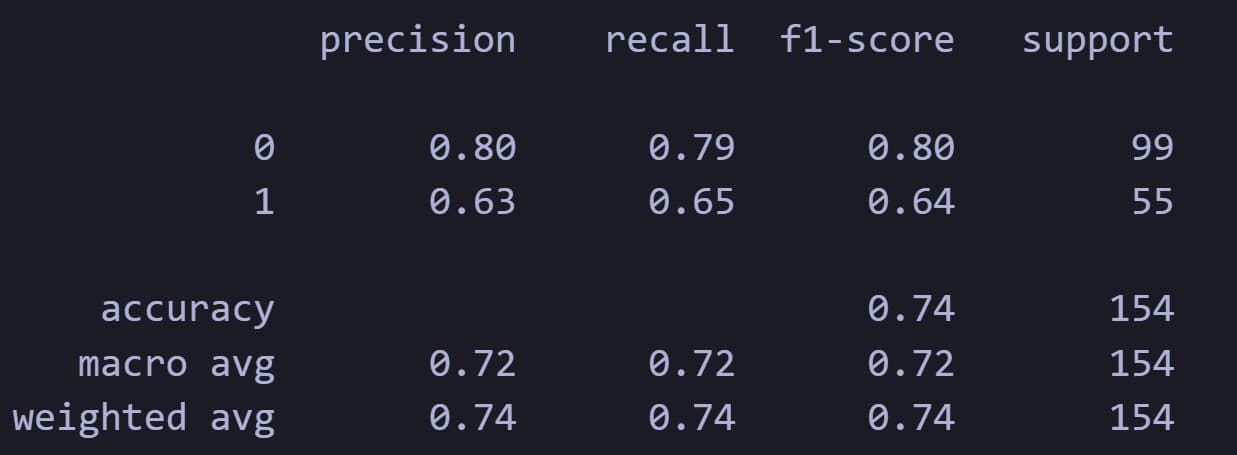
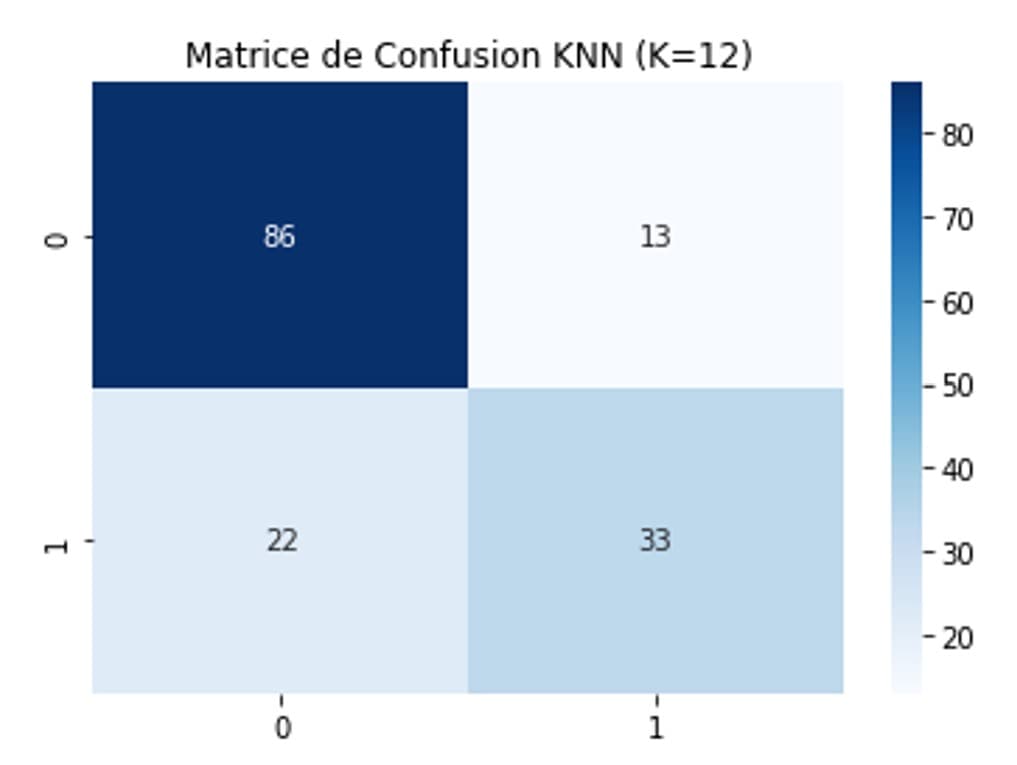
KNN — k=11
73.2% accuracy. Optimal k found by cross-validation. Sensitive to feature scale — StandardScaler applied. Interpretable but limited.
Random Forest — 100 trees
74.0% accuracy. Feature importance: Glucose > BMI > Age. Robust to outliers, but only marginal gain over KNN here.
SVM — RBF kernel
75.3% accuracy. Best AUC on ROC curve. Grid search over C and γ. The decision boundary generalises best on this dataset.
Unsupervised validation: K-Means finds the same truth
The most striking result wasn't from a supervised model. K-Means (k=2) was run on Glucose and BMI only — without using the labels at all.
K-Means found the diabetic cluster without looking at a single label. The structure was real, not learned.
The two clusters align almost exactly with the SVM decision boundary. This means the two-class structure is genuinely present in the geometry of the data — the supervised models are not inventing a separation that isn't there.
What this demonstrates
This project demonstrates the full ML pipeline — not just the modelling step. Data cleaning with biological reasoning, EDA before any model is fit, supervised learning with cross-validation tuning, and unsupervised validation to check that the supervised boundary reflects real structure. The K-Means result is the one worth remembering: it shows the classification problem is real, not an artefact of the training procedure.